
Stockton CBC Trends
We have collected and analyzed the Stockton CBC data from 1970 till 2023. Some bird trends we observe from Stockton CBC data. We will be updating this page with more bird trends from Stockton CBC data.
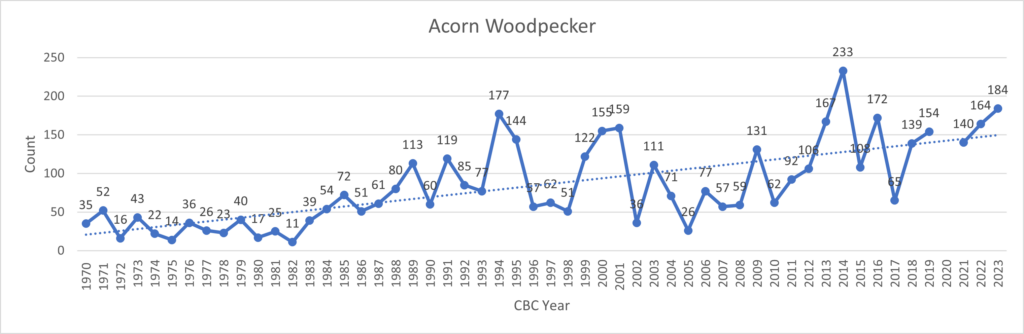
Acorn Woodpecker
Population Dynamics
- Overall Trend: The Acorn Woodpecker population has shown a general increase over the 53-year period, with significant fluctuations
- Early Years: From 1970 to 1983, the population remained relatively low, rarely exceeding 50 individuals.
- Mid-Period Growth: A noticeable increase began in the mid-1980s, with the population often surpassing 100 individuals from 1988 onwards.
- Peak Years: The highest recorded populations were in 2012 (233 individuals), 2015 (172 individuals), and 2023 (184 individuals).
- Recent Stability: Since 2020, the population has remained consistently above 140 individuals, suggesting a potential stabilization at a higher level.
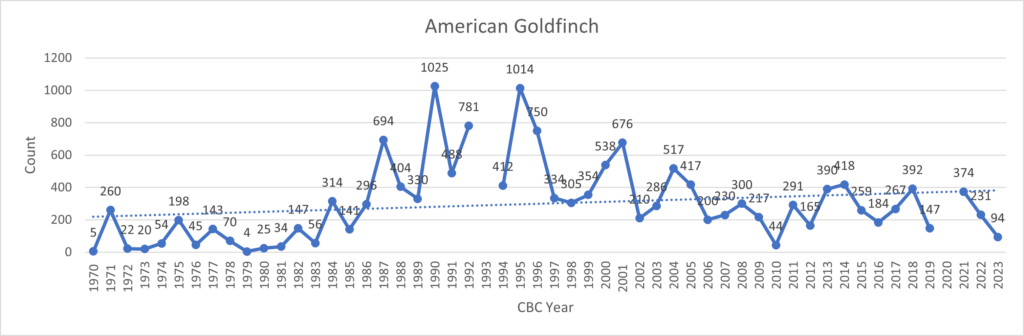
American Goldfinch
Population Dynamics
- Overall Trend: The American Goldfinch population has shown significant fluctuations over the 53-year period, with a general increase from the 1970s to the 1990s, followed by a more variable pattern in recent decades.
- Early Years: The population started low in 1970 (5 individuals) but quickly increased to 260 in 1971. The 1970s saw considerable variability.
- Peak Years: The highest recorded populations were in 1989 (1,025 individuals), 1994 (1,014 individuals), and 1990 (781 individuals).
- Recent Trend: Since 2000, the population has shown a general decline with fluctuations, ranging from 44 to 676 individuals.
- Current Status: The most recent count in 2023 shows 94 individuals, which is relatively low compared to historical peaks but not unprecedented.
More Info
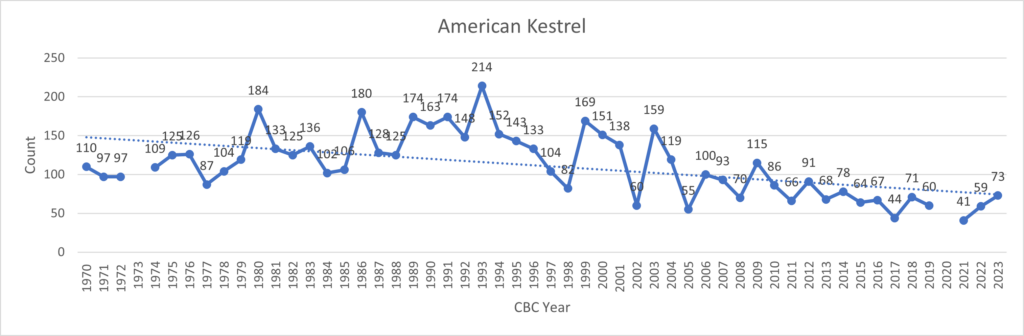
American Kestrel
Population Dynamics
- Overall Trend: The American Kestrel population has shown significant fluctuations over the 53-year period, with a general decline evident in recent years.
- Peak Years: The highest recorded populations were in 1992 (214 individuals), 1980 (184 individuals), and 1986 (180 individuals).
- Recent Decline: Since the early 2000s, there has been a noticeable downward trend, with the population dropping to its lowest points in 2020 (41 individuals) and 2016 (44 individuals).
- Current Status: The most recent count in 2023 shows 73 individuals, which is an improvement from the lowest points but still significantly lower than historical highs.
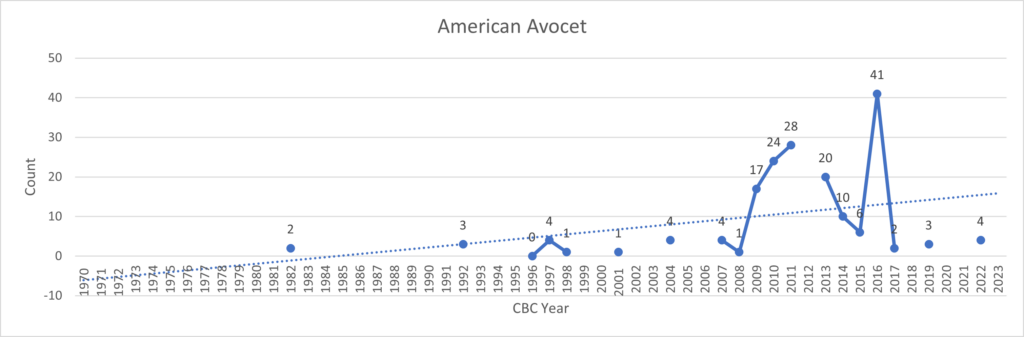
American Avocet
Population Dynamics
- Early Years: No data is available from 1970 to 1982.
- Sporadic Observations: Between 1983 and 2005, there are only three years with recorded data (1983, 1996, and 2000), showing very low numbers (2, 3, and 4 individuals respectively)
- Recent Increase: From 2006 onwards, data becomes more consistent, with a general upward trend
2006-2010: Numbers fluctuate between 1 and 17 individuals.
2011-2015: A significant increase is observed, peaking at 28 in 2013.
2016-2023: Numbers continue to fluctuate, with the highest count of 41 in 2019. - Highest Count: The peak population was observed in 2019 with 41 individuals.
- Recent Decline: After the 2019 peak, numbers dropped significantly to 2 in 2020 and 3 in 2021.
- Recovery: The most recent data point in 2023 shows 4 individuals, suggesting a possible recovery from the 2020-2021 decline.
American Crow
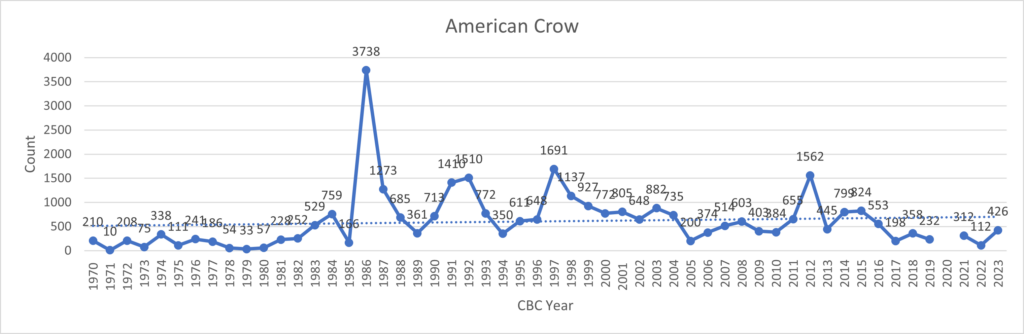
Population Fluctuations
The American Crow population shows significant fluctuations over the years:
Highest Count: The peak population was observed in 1986 with 3,738 individuals.
Lowest Count: The lowest recorded population was 10 in 1971.- Early Years: From 1970 to 1985, the population remained relatively low, mostly under 1,000 individuals.
- Mid-1980s Spike: There was a dramatic increase in 1986 to 3,738, followed by a sharp decline.
- 1990s-2000s: The population showed more stability but with occasional spikes, such as 1,691 in 1997.
- Recent Years: From 2015 onwards, the population has generally remained below 1,000, with some fluctuations.
Notable Periods
- 1986 Anomaly: The sudden spike to 3,738 in 1986 is particularly noteworthy and may warrant further investigation into potential causes.
- 1990s Increase: There was a general upward trend in the 1990s, with several years exceeding 1,000 individuals.
- 21st Century: The population has been more variable, with occasional high counts (e.g., 1,562 in 2011) interspersed with lower numbers.
More Info
American Bittern
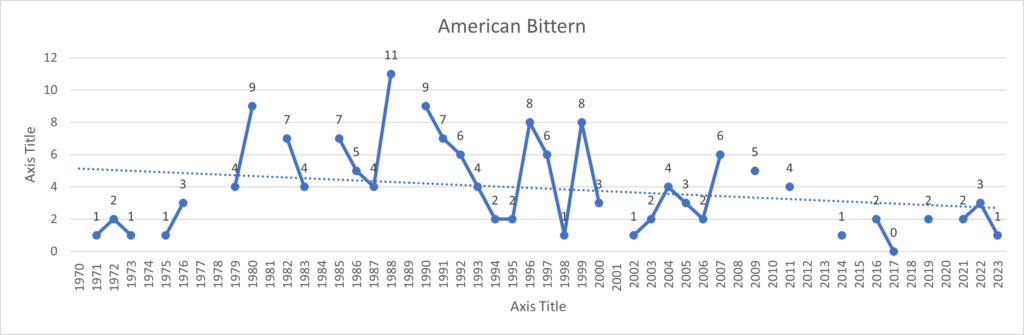
Population Dynamics
- Early Years (1970-1979):
Sporadic observations with counts ranging from 1 to 4 individuals.
Several years with no recorded data. - 1980s:
More consistent data collection.
Peak count of 9 individuals in 1980.
Generally higher numbers compared to the 1970s. - 1990s:
Relatively stable population with counts mostly between 2 and 9 individuals.
Highest count of 11 in 1988. - 2000s-2010s:
More variable counts, ranging from 0 to 8 individuals.
Several years with low counts (1-3 individuals). - Recent Years (2020-2023):
Low but consistent counts, ranging from 1 to 3 individuals.
Highest Count: 11 individuals in 1988.
Several years with only 1 individual recorded.
American Coot
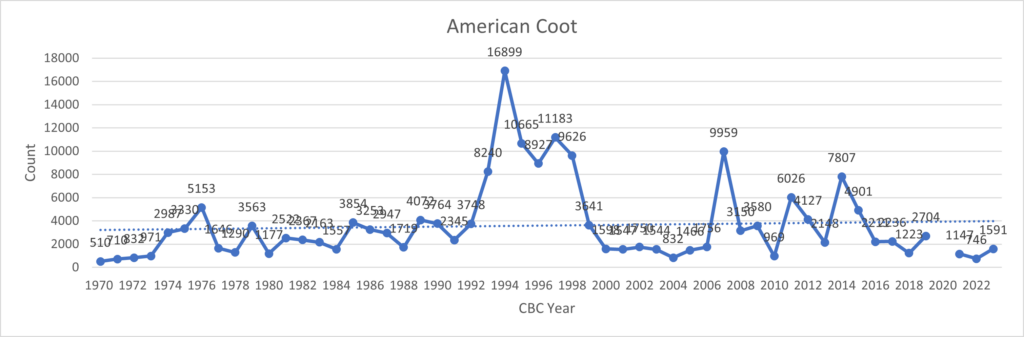
Population Dynamics
- Population Overview
Peak Population: 16,899 individuals in 1996
Lowest Recent Count: 746 in 2022 - Overall Trend: Rapid growth from 1970 to the mid-1990s, followed by a sharp decline and volatility in recent decades.
- 1970s–1980s
Steady growth from 510 (1970) to 3,854 (1986)
First major spike in 1975 (2,987) and 1976 (5,153)
Declines interspersed with recoveries (e.g., drop to 1,290 in 1978, then rebound to 3,563 in 1979) - 1990s Boom
Exponential growth: 8,240 in 1994 to 16,899 in 1996
Sustained high counts: 10,665 (1997), 11,183 (2000) - Post-2000 Decline
Collapse to 1,598 by 2003 (86% drop from 2000 peak)
Partial recovery in 2005–2008 (9,959 in 2005)
More Info